Oil traders celebrated the April 8 ceasefire between the United States and Iran as if it were a peace treaty. Brent crude fell 13% in a single session, from $110 to $94.75 per barrel. WTI dropped 16% to $94.41. It was the largest one-day decline since the pandemic crash of April 2020.
The celebration lasted four days.
By April 12, when JD Vance announced that follow-up talks in Doha had collapsed, Brent was back above $103 and climbing. Trump declared a naval blockade. WTI surged past $104. The gap between what the ceasefire promised and what the strait actually delivered had become impossible to ignore.
What the Ceasefire Actually Said
The April 8 agreement, brokered in part by Oman, established a two-week pause in military operations. Both sides agreed to halt airstrikes and missile launches. Iran's Revolutionary Guard committed to allowing "safe passage" through the Strait of Hormuz for commercial vessels.
On paper, this should have reopened the world's most important energy chokepoint. In practice, it did nothing of the sort.
The ceasefire text contained no provisions for mine clearance. The IRGC had laid sea mines throughout the strait over the preceding five weeks — an action it never publicly acknowledged. Commercial insurers knew. Lloyd's Joint War Committee kept the strait on its listed areas register. War-risk premiums, which had reached 5% of hull value (roughly $6 million per VLCC transit), did not move a single basis point after the ceasefire announcement.
The insurance market is not sentimental. It prices physical risk, not diplomatic optimism.
Iran's Toll Strategy
What the ceasefire did produce was something unexpected: a pricing mechanism. Within 48 hours of the agreement, reports emerged that Iran's IRGC was offering "transit facilitation" — safe passage through the strait in exchange for tolls of $1 to $2 million per vessel, payable exclusively in Chinese yuan or cryptocurrency.
This was not a humanitarian gesture. It was a revenue strategy. At $1.5 million per transit and even 30 transits per day (a fraction of the pre-crisis 100+), Iran could generate $45 million per day — $1.35 billion per month. For a sanctions-strangled economy, this was transformative income, derived from the one piece of leverage Iran held that no sanctions regime could take away: geography.
The toll also served a strategic purpose. By allowing some traffic through under Iranian control, Tehran demonstrated that the strait was not "closed" in the formal legal sense. It was available — for a price, on Iran's terms, under Iran's guns.
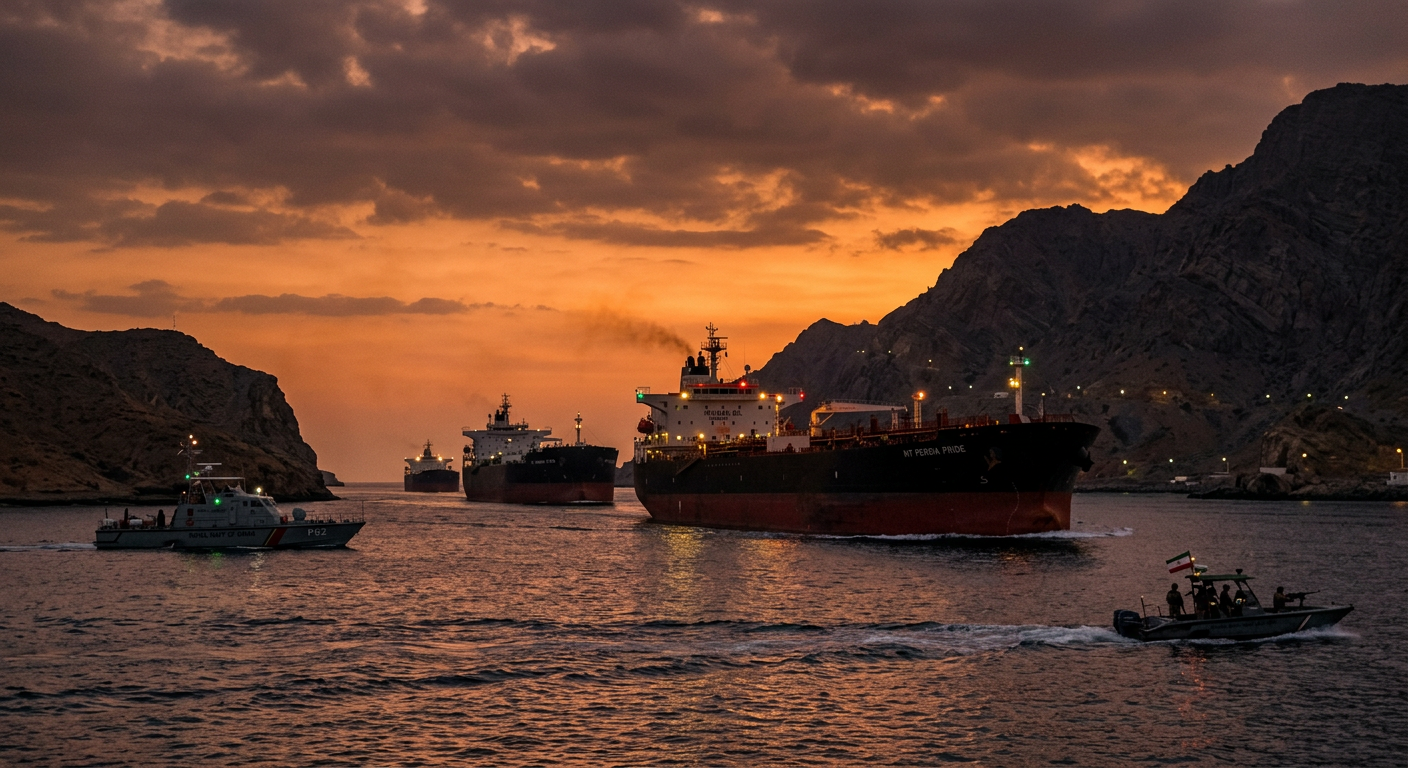
Three Ships and a Signal
On April 11, three Chinese-flagged supertankers made the crossing. They were the first oil-laden vessels to transit the strait since the war began. All three appeared to be under Chinese naval escort, though Beijing did not confirm this. The crude they carried was widely assumed to be bound for Chinese refineries under pre-existing purchase agreements.
The market read this event in two ways simultaneously. Optimists saw proof that transit was possible and that the ceasefire was beginning to function. Realists noted that three ships in one day, versus the pre-crisis baseline of 60-100 tankers per day, represented a 95-97% reduction in normal traffic. The three ships were the exception that proved the rule: only vessels with the backing of a military power willing to escort them through a mined strait were moving.
No Western-flagged, Western-insured vessel attempted the crossing.
The Oil Price Whipsaw
The price action between April 7 and April 12 tells the entire story of market misunderstanding.
Before the ceasefire: Brent at $110, reflecting full blockade pricing plus escalation risk. The April 8 drop to $94.75 priced in a return to near-normal shipping within weeks. Traders who had built long positions during the crisis took profits. Short-sellers piled in.
Then reality intervened. Day one post-ceasefire: zero transits. Day two: zero. Day three: the three Chinese supertankers, nothing else. Lloyd's premiums unchanged. Mine-clearing operations not initiated. IRGC tolls reported.
The market corrected. Brent climbed back through $100 on April 10, past $103 on April 11, and then the Doha collapse on April 12 sent it surging past $104 with Trump's blockade announcement.
The round trip — $110 to $94 to $104 — cost traders who bought the ceasefire narrative approximately $10 per barrel in failed optimism. More importantly, it revealed a structural misunderstanding about what a ceasefire means for a maritime chokepoint.
What Gasoline Prices Did (and Didn't Do)
The most striking consumer-facing data point is what happened to gasoline during the oil whipsaw: almost nothing. US retail gasoline moved from $4.00 to $3.96 per gallon — a $0.04 decline against a $16 oil price drop.
This asymmetry has a name in economics: rockets and feathers. Gasoline prices rise like rockets when crude spikes but fall like feathers when crude retreats. Gas station operators, wholesalers, and refiners have no incentive to cut prices rapidly during a period of extreme uncertainty. They know the crude drop may reverse — as it did. They hold their margins and wait.
For consumers, this means the ceasefire delivered no meaningful relief at the pump. The 38% increase from $3.01 to $4.00+ that occurred during the first five weeks of the crisis remained intact even as oil futures swung wildly on diplomatic news.
The Insurance Signal Is the Truth
If you want to know whether the Hormuz crisis is actually easing, ignore the oil price. Watch the insurance market.
War-risk premiums for Hormuz transit are the clearest real-time indicator of physical shipping risk. They are set by underwriters who lose real money if they underprice risk. They reflect actual vessel damage data, mine survey intelligence, and military threat assessments — not diplomatic optimism.
As of April 12, those premiums have not declined. The Lloyd's JWC listing has not changed. P&I clubs have not reinstated coverage for unescorted transits. This tells you everything the ceasefire did not.
What Comes Next
Three scenarios remain in play for April and May.
Scenario 1: Mine clearance begins. If US or allied naval forces begin systematic mine-clearing operations in the strait, and if Iran does not remine, the physical blockade could begin to ease over 4-8 weeks. Insurance would begin to adjust downward. Oil could retreat to $85-90. This is the optimistic case.
Scenario 2: Tolled transit normalizes. Iran continues operating the toll system, gradually expanding to accommodate 20-30 transits per day. Oil stabilizes in the $90-100 range. A new equilibrium emerges where the strait is "open" but at a significant cost premium that embeds itself into energy prices for months or years. This is the most likely near-term outcome.
Scenario 3: Escalation resumes. The Doha collapse leads to renewed military operations. Trump's blockade announcement adds a second layer of restriction. Oil goes back above $110. This scenario is non-trivial given the April 12 developments.
For consumers, all three scenarios share one feature: gasoline stays above $3.75 through the summer. The transmission to food and household goods prices, driven by diesel and fertilizer costs, continues with a 60-90 day lag regardless of diplomatic developments. The damage to supply chains was done in March. It is arriving at checkout counters now.