The Invasion and the Immediate Oil Price Spike
At approximately 5:00 a.m. local time on February 24, 2022, Russian forces crossed into Ukraine from three directions: from Belarus toward Kyiv in the north, from Russian territory in the east, and from the Crimean peninsula in the south. The largest land war in Europe since World War II had begun. Financial markets had been pricing some probability of an invasion for weeks, but the scale of the opening assault -- cruise missiles hitting Kyiv within minutes of the announcement, multiple simultaneous ground offensives -- exceeded what most analysts had priced in.
Oil markets moved immediately. Brent crude, which had already risen from below $80 per barrel in December 2021 to approximately $96 on the eve of the invasion, surged past $100 on February 24. Within two weeks it reached $130 per barrel -- a 14-year high. WTI crude followed the same trajectory, briefly touching $130.50 on March 7, 2022, the highest intraday price since the summer of 2008.
The mechanism was straightforward but multi-layered. Russia is the world's second-largest oil producer, responsible for approximately 10-11% of global supply at roughly 10 million barrels per day before the invasion. It is also the largest single supplier of piped natural gas to Europe. The EU imported roughly 45% of its natural gas from Russia in 2021, with Germany alone sourcing over 55% of its gas supply via Russian pipelines. A major conflict involving Russia -- and the potential for sanctions, pipeline disruptions, or deliberate supply cuts -- threatened that flow in ways the market had not had to price since the Cold War.
The United States and European Union began rolling out sanctions packages within days of the invasion. The most consequential for energy markets was the U.S. ban on Russian oil, gas, and coal imports, announced by President Biden on March 8. The EU took longer, given its far deeper dependence on Russian energy, but eventually announced a phased embargo on Russian oil imports. The UK followed separately. These measures did not immediately remove Russian oil from global markets -- Russia rerouted much of its crude to India, China, and Turkey at discounted prices -- but they restructured trade flows, created logistical friction, and injected premium uncertainty into every forward oil curve.
Energy Costs and Shipping: A Direct Line
Bunker fuel -- the heavy residual oil that powers most commercial vessels -- tracks crude oil prices with a roughly two-to-four-week lag, depending on refinery processing schedules and regional fuel inventory levels. When Brent crude doubled from $65 to $130 between January and March 2022, bunker prices followed. Very low sulfur fuel oil (VLSFO), the post-IMO 2020 standard bunker grade for most ocean-going vessels, rose from approximately $500-550 per ton in December 2021 to over $1,100 per ton by late March 2022 -- a doubling in roughly twelve weeks.
For a large container ship burning 150-200 tons per day at cruising speed, this was a cost increase of $75,000 to $110,000 per day in fuel alone. On a twenty-day transoceanic voyage, that translated to $1.5 to $2.2 million in additional fuel cost per trip compared to the previous year. Tankers and bulk carriers, with generally lower power requirements, saw somewhat smaller absolute increases, but the proportional impact on operating economics was similar.
Bunker Fuel Cost: Container Ship, 20-Day Pacific Crossing
Shipping companies responded through Bunker Adjustment Factors, or BAF -- surcharges applied on top of the base freight rate, calibrated to track fuel cost changes. For most major container carriers, BAF formulas are transparently published and updated quarterly or monthly. In practice, during the 2022 oil spike, BAF surcharges added $400 to $2,000 per forty-foot equivalent unit on top of already-elevated pandemic-era base rates, depending on trade lane, vessel size, and carrier. The BAF mechanism means that fuel cost increases do not simply compress carrier margins -- they pass through to the shippers who buy the space, and from there to the manufacturers, retailers, and ultimately consumers who pay for goods transported in those containers.
The Black Sea Grain Corridor
Ukraine and Russia together account for roughly 30% of global wheat exports, 20% of corn exports, and 80% of global sunflower oil exports. Ukraine alone supplies approximately 10% of the world's wheat and 15% of its corn. These are not marginal figures. In countries across North Africa, the Middle East, and South Asia where wheat imports from the Black Sea region represent the majority of domestic supply, the invasion threatened food security in the most direct possible way.
The Black Sea itself became a war zone within days. Ukrainian ports -- Odesa, Mykolaiv, Kherson, Mariupol -- were either under attack, mined, or blockaded by the Russian Navy. Commercial vessels that were already in Ukrainian ports on February 24 were trapped. Over the following weeks, several commercial ships were hit by mines or missiles; at least two were sunk. Marine insurers immediately withdrew coverage for the Black Sea, and vessel operators refused to send ships into waters where they could not be insured and where the risk of loss was real and immediate.
Ukraine had exported approximately 6 million tons of grain per month via its Black Sea ports before the invasion. That flow stopped almost entirely in the first weeks after February 24. The alternative -- overland rail through Poland, road transport through Romania and Hungary, and river barge to Danube ports -- could handle, at peak effort, roughly 2-3 million tons per month. The logistical infrastructure simply did not exist to substitute for deep-water bulk carrier loading at scale.
The United Nations brokered the Black Sea Grain Initiative -- commonly called the "grain corridor" -- in July 2022, after months of negotiation. The deal allowed Ukrainian grain ships to transit a designated corridor to the Bosphorus under a joint inspection regime involving the UN, Turkey, Ukraine, and Russia. Between August 2022 and July 2023, when Russia withdrew from the agreement, the corridor facilitated the export of approximately 32 million metric tons of food commodities from Ukrainian ports. Odesa's grain terminals and the ports of Pivdennyi and Chornomorsk restarted bulk loading under the initiative.
The corridor worked, imperfectly and intermittently, but it worked. Grain prices fell from their March 2022 peaks as the corridor opened and as markets internalized the fact that Ukrainian agriculture had not been destroyed -- winter wheat was harvested in July 2022 at below-normal but still substantial volumes. However, the corridor's vulnerability was always apparent. Russia threatened to withdraw repeatedly and finally did so in July 2023, triggering an immediate 8% single-day spike in wheat futures.
The Fertilizer Price Explosion
The least visible but arguably most lasting supply chain effect of the 2022 energy shock was the fertilizer market. Nitrogen fertilizers -- urea, ammonium nitrate, UAN solution -- are manufactured from natural gas. Natural gas is both the feedstock (hydrogen from methane reacts with atmospheric nitrogen) and the energy source for the Haber-Bosch synthesis process that has underpinned industrial agriculture since the early twentieth century. Approximately 1.7% of global energy consumption goes into making fertilizer; roughly 1.4% of global natural gas supply is converted into nitrogen fertilizer.
Russia is the world's largest exporter of nitrogen fertilizers and a major exporter of potash and phosphate-based fertilizers. When European natural gas prices spiked from roughly $25 per MWh in early 2021 to over $300 per MWh at their September 2022 peak -- a twelve-fold increase driven by Russian supply restrictions and war-related uncertainty -- European fertilizer producers found themselves unable to operate profitably. Plants across Belgium, Germany, France, and the UK curtailed or halted production entirely. The continent went from producing roughly 15-20% of global nitrogen fertilizer to near-zero output in affected facilities.
Fertilizer Prices: Urea (Eastern Europe, bulk, $/metric ton)
The downstream effects unfolded over crop cycles, not months. Farmers make fertilizer purchasing decisions in the autumn for the following spring's planting season. When urea cost $900 per ton in autumn 2022 versus $280 the year before, farmers across Europe, North America, and Asia reduced application rates. Some reduced planted acreage entirely. The consequence was not a single-season famine -- global grain stocks provided a buffer -- but a multi-year reduction in yield improvement trajectories. Agricultural economists estimated that the fertilizer shock would reduce global cereal output by 2-4% over the 2022-2024 crop years, with the greatest impacts in South Asia and sub-Saharan Africa, where farmers had the least ability to absorb input cost increases or access alternative suppliers.
How Energy Costs Cascade Through Food Supply Chains
The 2022 shock was a master class in energy-to-food price transmission. The pathway has several distinct links, each adding cost and each responding to oil and gas prices at a different speed.
Link 1: On-farm energy. Modern agriculture is energy-intensive. Tractors, harvesters, irrigation pumps, grain dryers, and cold storage all run on diesel or electricity. When diesel prices roughly doubled -- from approximately $3.25 per gallon in early 2021 to over $5.50 nationally in June 2022 -- farm operating costs rose sharply. The USDA estimated that energy represented approximately 15-20% of total crop production costs; at peak 2022 prices, this component alone increased farm costs by $150-200 per acre for fuel-intensive crops.
Link 2: Fertilizer (slow-transmission link). As described above, natural gas prices flow into fertilizer prices over a one-to-three-month lag, and fertilizer prices affect farm economics over a crop-year cycle. The full fertilizer shock took the entirety of 2022 and into 2023 to work through crop budgets and output decisions.
Link 3: Food processing and transport. Food manufacturing facilities are heavy energy users -- refrigeration, cooking, drying, packaging, and heating all consume significant electricity and natural gas. European food processors faced natural gas bills that were three to five times their 2020 costs by autumn 2022. These costs feed directly into producer price indexes and, with a lag of typically two to six months, into consumer food prices.
Link 4: Shipping and freight. As described above, bunker fuel costs doubled in early 2022. For bulk agricultural commodities -- grain, oilseeds, fertilizer raw materials -- the relevant shipping market is the dry bulk sector. The Baltic Dry Index (BDI), the benchmark for dry bulk rates, had already been elevated through 2021 due to pandemic demand. In 2022, the energy cost pass-through via BAF surcharges added further pressure to the cost of moving grain from export origins to import destinations. For countries in sub-Saharan Africa and the Middle East that import bulk grain, the combined effect of higher commodity prices and higher freight costs was compounded.
Link 5: Retail and distribution. Trucking, the last mile of food distribution, runs entirely on diesel. At peak U.S. diesel prices of over $5.80 per gallon in June 2022, trucking costs rose roughly 60-80% year-over-year. Grocery retailers faced higher transportation surcharges from distributors and began passing costs to consumers. The consumer-facing price increase was visible but lagged the wholesale market by one to three months, depending on contract structures and retailer pricing strategy.
The Timeline of Escalation
CPI Anatomy: Where the Inflation Actually Came From
The June 2022 CPI reading of 9.1% was the headline number that defined the inflationary episode, but the composition of that number reveals the energy-shipping-food transmission mechanism with unusual clarity.
Energy contributed approximately 3.3 percentage points to the 9.1% total -- more than a third of headline inflation. The energy sub-index rose 41.6% year-over-year in June 2022. Gasoline was up 59.9%. Fuel oil for home heating was up 98.5%. Electricity rose 13.7%, reflecting natural gas cost pass-through by utilities. This was not routine inflation. This was the direct price signal of a commodity supply shock working through every link in the energy delivery chain.
Food contributed approximately 1.3 percentage points. Food at home (groceries) rose 12.2%, the largest annual increase since 1979. Cereals and bakery products were up 14.1%. Meat, poultry, fish, and eggs were up 11.7%. Fats and oils -- largely reflecting the sunflower oil supply disruption -- were up 19.1%. These were not demand-driven price increases. They were supply disruptions, expressing themselves through grocery aisle price tags with the typical two-to-six-month transmission lag from commodity markets.
Core services -- shelter, healthcare, transportation services -- contributed the remaining roughly 4 percentage points. Some of this reflected genuine demand-side pressure from the tight labor market and the post-pandemic consumption surge. But transportation services, including airfare and vehicle insurance, were directly affected by fuel costs. Shelter inflation was already running hot before the invasion and represented a different structural dynamic, though energy costs for property operations feed into rental pricing over time.
The Fed's Response and the Cost of Energy-Driven Inflation
The Federal Reserve's challenge in 2022 was a specific and uncomfortable one: it was trying to control inflation that was substantially caused by supply shocks it had no ability to address. Raising interest rates does not produce more wheat, does not rebuild fertilizer plant output, does not re-route oil pipelines. Monetary policy works on demand. The 2022 inflation was substantially a supply-side phenomenon.
And yet the Fed had no choice but to act. The supply shocks were real, but they were feeding into wage-price dynamics that the Fed was responsible for containing. Inflation expectations, once unanchored, are historically difficult and painful to re-anchor. The Fed's credibility as an inflation fighter was on the line in a way it had not been since the Volcker era.
The resulting tightening cycle was the fastest since the early 1980s. The Fed raised the target range for the federal funds rate from 0.00-0.25% in March 2022 to 4.25-4.50% by December 2022 -- a 425-basis-point move in nine months. It continued raising in 2023, reaching a peak target range of 5.25-5.50% in July 2023. The consequence was a significant tightening of financial conditions globally: mortgage rates doubled, corporate borrowing costs rose sharply, and several emerging-market economies that had borrowed in dollars faced currency pressure and debt-servicing stress.
The inflation-control campaign eventually worked. CPI fell from 9.1% in June 2022 to below 3% by mid-2023. But the path was long, expensive, and required a degree of economic tightening that itself created distributional consequences -- higher unemployment risk for low-income workers, a sharp housing affordability deterioration from the mortgage rate increase, and stressed public finances in developing nations that had borrowed in dollars.
Container Rates: The 2022 Context
Container shipping rates in 2022 occupied a peculiar position. Pandemic-era rates -- which had been at all-time highs through 2021 -- were already beginning to decline by early 2022 as capacity came back to market and the most acute port congestion eased. The Russia-Ukraine invasion did not reverse this trend for container shipping the way it did for energy and bulk commodity markets, primarily because container shipping is not directly a Black Sea or Eastern European trade. The main Asia-to-Europe container trade lane runs via the Suez Canal -- not through the Black Sea -- and its costs are driven more by container volume and capacity than by commodity supply disruptions.
The war's container shipping impact came primarily through two indirect channels. First, the fuel cost spike via BAF surcharges, as described above, added $400-2,000 per FEU in supplemental charges on top of base rates throughout 2022. Second, the cascading effect on European industrial output -- steel plants, fertilizer manufacturers, and energy-intensive producers reducing output due to gas costs -- reduced European import demand for manufactured goods, softening container rates on Asia-to-Europe lanes from their pandemic peaks more quickly than they would otherwise have fallen.
The net result was that 2022 saw container rates fall from their extraordinary pandemic peaks while still remaining well above historical norms, with the energy surcharge partially offsetting the volume-driven correction. The Shanghai Containerized Freight Index composite fell from over 5,000 points at the start of 2022 to below 1,000 by the end of the year -- a collapse that masked the underlying fuel cost reality and misled some observers into concluding that shipping inflation was fully resolved.
Parallels and Differences with the 2026 Hormuz Crisis
The 2022 energy shock and the 2026 Hormuz crisis share a structural template but differ in crucial ways that affect how the transmission mechanism operates.
The similarities are substantial. Both are geopolitical supply shocks originating in energy-producing regions. Both caused immediate oil price spikes in the $100+ range. Both involved a key waterway becoming inaccessible or significantly risky to transit, disrupting physical trade flows. Both triggered insurance premium surcharges that added to the all-in cost of any vessel attempting transit. Both demonstrated the speed with which an upstream energy disruption can cascade through food, fertilizer, and consumer goods within weeks.
Both also featured the same basic transmission lag structure: energy prices spike immediately (days), bunker fuel follows (weeks), freight surcharges appear (weeks to months), food and agricultural input costs rise (months to a full crop cycle), and consumer price indexes register the full impact (two to six months after the commodity shock begins). This lag structure is not an accident -- it reflects the time constants of physical supply chains, contract renegotiation cycles, and the mechanics of how price signals propagate from commodity origins to retail shelves.
2022 Energy Shock vs. 2026 Hormuz Crisis: Key Comparisons
| Dimension | 2022 Ukraine Shock | 2026 Hormuz Crisis |
|---|---|---|
| Oil price impact | Brent peaked ~$130 | Brent spiked $80-100+ range |
| Chokepoint affected | Black Sea (grain, not oil transit); indirect via Russia oil sanctions | Strait of Hormuz (21% of global oil, 17% of global LNG) |
| Duration | Ongoing (war continuing); $130 peak lasted ~3 weeks | Ongoing; duration uncertain |
| Alternative routing | Overland rail for grain; difficult at scale | No viable alternative for Hormuz oil volumes |
| Fertilizer impact | +80-150% (Russia = largest exporter; gas prices hit European production) | Elevated if gas prices spike; smaller direct Russia-source risk |
| Food inflation trigger | Direct: Ukraine/Russia = 30% of world wheat | Indirect: via energy costs and freight |
| Central bank posture | Tightening (rates at zero, needed to move to 5%+) | Rates already elevated; less room to tighten further |
The critical difference is the nature of the chokepoint. The Black Sea is an important grain export route but not a global oil transit chokepoint. When it closed, grain prices spiked and food-importing nations faced genuine supply risk, but global oil and LNG flows were not directly interrupted. The oil impact in 2022 came from the sanctions on Russia as a producer, not from the Black Sea as a transit route.
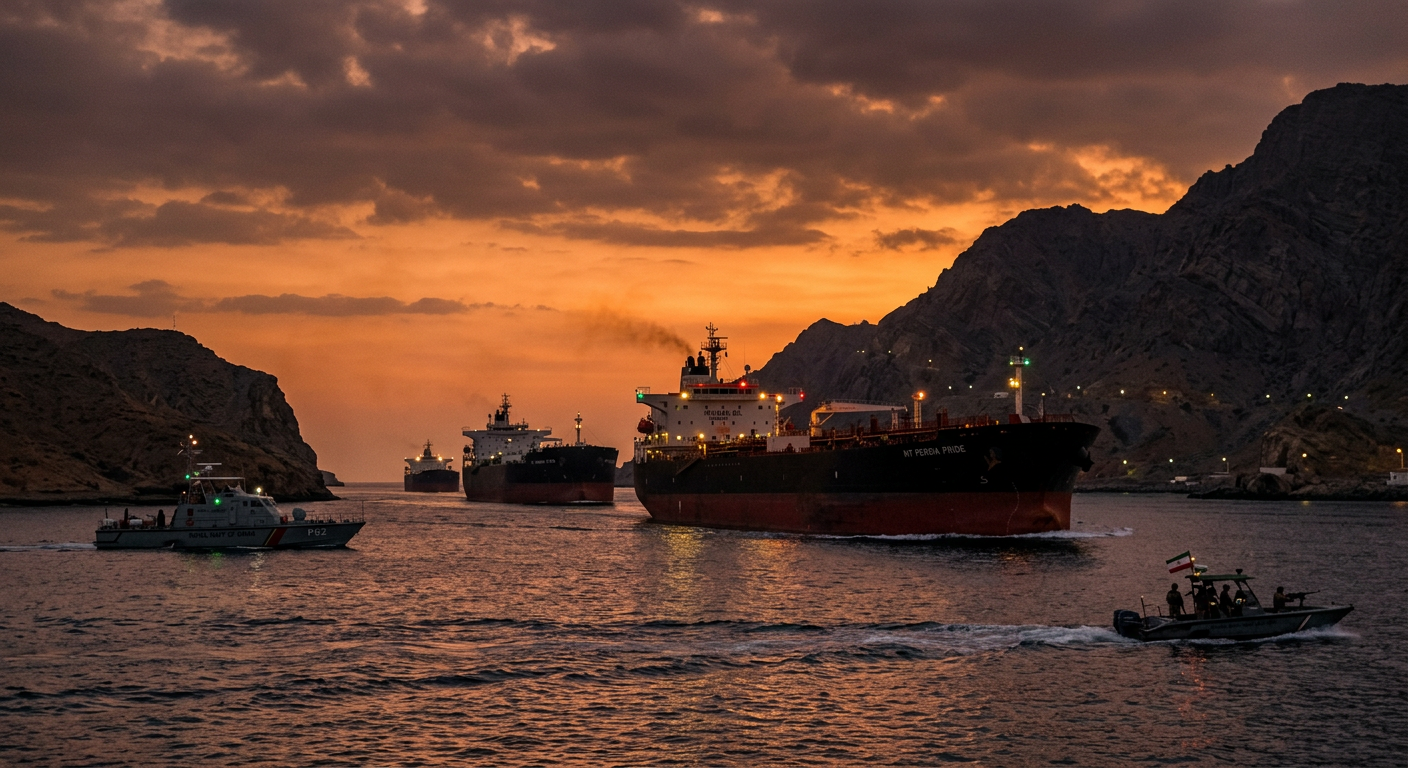
The Strait of Hormuz is the opposite. It is the world's single most critical oil transit chokepoint -- roughly 21 million barrels per day flow through it, representing about 21% of global petroleum liquids consumption. There is no alternative. The Trans-Arabian Pipeline to Yanbu on the Red Sea has a capacity of about 5 million barrels per day -- barely a quarter of Hormuz volumes, and it was mothballed for years before recent rehabilitation. The Abu Dhabi Crude Oil Pipeline to Fujairah has a capacity of 1.5 million barrels per day. Combined, bypass pipelines can handle roughly 6-7 million barrels per day. That leaves approximately 14-15 million barrels per day with nowhere to go if Hormuz closes.
This is why the 2026 Hormuz disruption, even if it is resolved sooner than the Russia-Ukraine war, carries a higher structural ceiling for oil price impact. The 2022 shock showed how fast supply uncertainty can drive Brent to $130. Hormuz is a larger physical constraint. The historical record of genuine Hormuz closure, or even serious threat of closure, is a Brent trajectory above $150 in most scenarios modeled by the IEA and major commodity traders.
Lessons Learned
The 2022 energy shock produced a body of hard-won insights for supply chain practitioners, policymakers, and commodity risk managers. Several are particularly relevant as a framework for understanding the 2026 disruption.
Energy is embedded in everything. The 2022 shock made visible what was always structurally true: energy prices are a substrate cost that runs beneath virtually every manufactured good, every agricultural product, every ton of freight moved. When oil and gas prices double, the increase does not stay in the energy sector. It propagates, at different speeds, through fertilizer, food, freight, manufacturing, and services. The CPI reading is the lagged aggregate of all these transmissions.
The grain-energy nexus is tighter than most people realize. Nitrogen fertilizer is manufactured from natural gas. Wheat is produced with fertilizer and diesel. Wheat is transported on bulk carriers running on bunker fuel. The price of a loaf of bread in Cairo, Nairobi, or Jakarta contains embedded natural gas from somewhere. When that gas price spikes, the bread price follows, reliably and with predictable timing.
Strategic reserves work, but slowly. The IEA coordinated the largest-ever release of strategic petroleum reserves in response to the 2022 shock -- approximately 240 million barrels over several months from IEA member countries. It helped, but it did not prevent oil from reaching $130. Strategic reserves are a buffer that buys time; they are not a substitute for the missing physical supply.
Export restrictions are self-defeating. When grain prices spiked in 2022, at least fifteen countries introduced food export restrictions -- India banned wheat exports, Indonesia restricted palm oil, Hungary halted grain exports, Argentina tightened export licensing. Each restriction, individually rational from a domestic food security standpoint, reduced the global supply available to the most vulnerable importers and pushed prices higher. The collective action failure was predictable and documented. It happened again in every previous food price crisis. It will happen again in the next one.
Insurance markets lead. Marine insurance repriced Black Sea exposure within days of the invasion. War-risk premiums are among the fastest-moving indicators of physical risk in global commodity trade. When insurance becomes unavailable or prohibitively expensive, physical flows follow -- not immediately, but within days to weeks. The insurance market is a leading indicator that often moves before freight rates, commodity prices, or policy announcements reflect the full extent of the disruption.
Key Takeaways
- 1. Energy-to-CPI transmission is fast and legible. The path from an oil price spike at the wellhead to a consumer price increase at the grocery store takes roughly two to six months. The 2022 experience charted this transmission in real time: invasion February 24, CPI peak June 2022 -- roughly four months of propagation lag at full speed.
- 2. Fertilizer is the hidden link between energy and food. Natural gas to urea to crop yield to food price. This chain operates on a crop-cycle timescale, meaning fertilizer price shocks take one to two growing seasons to work fully through food output. The 2022 fertilizer shock is still affecting yield trajectories in 2024 and 2025.
- 3. Chokepoint type determines the ceiling. The Black Sea is a grain chokepoint. Its closure raised food prices dramatically but did not directly restrict global oil flows. Hormuz is an oil chokepoint with no viable full alternative. Its restriction carries a higher ceiling for energy price impact, which cascades into a higher ceiling for everything downstream.
- 4. Central banks cannot fix supply shocks. The Fed raised rates 425 basis points in 2022. It could not produce wheat, build fertilizer plants, or re-route pipelines. Rate hikes controlled demand and anchored expectations, but they imposed significant economic cost on households and businesses that were already paying elevated commodity prices. Supply-shock inflation is harder to control than demand-shock inflation, and the treatment has worse side effects.
- 5. The lag structure is a tradeable signal. Each link in the energy-shipping-food-CPI chain operates on a known approximate lag. Energy prices move first. Bunker fuel follows in weeks. Freight surcharges appear in weeks to months. Agricultural input costs take a planting season. Consumer food prices follow with two to six months. Understanding where a current shock sits on this timeline allows supply chain managers and risk analysts to project forward with structured confidence, rather than extrapolating blindly from the current headline number.